Myenergi Eddi & Raspberry Pi
SOLAR POWER LEVEL INDICATOR
You can turn a Raspberry Pi into a visual level indicator to see the status of your solar energy production at a glance.
This simple DIY solution is based on a solar system with a Myenergi Eddi energy diverter installed, with both CT clamps in use (one to measure production and one to measure the grid). The script is easily adaptable to other systems or configurations.
You will need the Blinkt led strip from Pimoroni and of course a Raspberry Pi.
The first steps are:
- Get an API key for your Myenergi product
- Add a bash script to download the Myenergi JSON file
- Add a Python script to set the LEDs
- Create a crontab to run every 2 minutes from 04:00 to 20:00
Log into your myenergi account and look for your product to get the serial number & click the Advanced option to get the API key (password). Don’t mind the API warning, this only applies to the API key being generated. You need these details for the bash script further below.


The bash script uses curl to download the JSON file and upon successful download starts the Python script to set the LEDs. You can use crontab to run this bash script at regular intervals. In this example we use the user “pi” and a subdirectory “pilevel”. Go to this directory and enter “nano eddi-json.sh”:
#!/bin/bash

if curl --silent --anyauth -u #SERIAL:#API -H 'accept: application/json' -H 'content-type: application/json' --compressed 'https://s18.myenergi.net/cgi-jstatus-*' > /tmp/eddi.json; then

 chmod 777 /tmp/eddi.json
 python /home/pi/pilevel/eddi-status.py

fi
Make the bash script executable with “chmod +x eddi-json.sh”.
To install Blinkt on the Raspberry use:
sudo apt-get install python-blinkt
Next one to create is the Python script, use “nano eddi-status.py”
#!/usr/bin/env python
# (c) JF Nutbroek
# 14/11/2022

import json
import math
import blinkt
import time

# User defined input
threshold = 0.03  # Minimum threshold power % for LED activation
brightness = 0.05 # Brightness of the LEDs

# ********* Start

# Clear all LEDs
blinkt.set_clear_on_exit(False)
blinkt.set_brightness(brightness)
blinkt.clear()
blinkt.show()

# Read the JSON file
try:
 json_file = open("/tmp/eddi.json", "r")
 myenergi = json_file.read()
 data = json.loads(myenergi)[0]['eddi'][0]
except:
 exit()

# Obtain the power usage
if 'div' in data:
  diverted_power = data['div']
else:
  diverted_power = 0

if 'gen' in data:
  solar_power = data['gen']
else:
  solar_power = 0

if 'grd' in data:
  grid_power = data['grd']
else:
  grid_power = 0

# Calculate the power per LED
total_leds = blinkt.NUM_PIXELS
if grid_power > 0:
 pwr_per_led = (grid_power + solar_power) / total_leds
else:
 pwr_per_led = solar_power / total_leds

# Threshold conditions
if diverted_power < threshold * (pwr_per_led * total_leds):
 diverted_power = 0

if solar_power < threshold * (pwr_per_led * total_leds):
 grid_power = grid_power + solar_power

if abs(grid_power) < threshold * (pwr_per_led * total_leds):
 grid_power = 0

# LEDs
red_leds = 0
blue_leds = 0
white_leds = 0

# Calculate the colors
if diverted_power > 0:
 blue_leds = max(1, math.floor(diverted_power / pwr_per_led))

if grid_power > 0:
 red_leds = max(1, math.floor(grid_power / pwr_per_led))

if grid_power < 0:
 white_leds = max(1, math.floor(abs(grid_power) / pwr_per_led))

# Set all LEDs to GREEN
for led in range(0, int(total_leds)):
  blinkt.set_pixel(led, 0, 255, 0)
  time.sleep(1.0 - (0.1 * led))
  blinkt.show()

# BLUE
if blue_leds > 0:
 for led in range(0, int(blue_leds)):
  blinkt.set_pixel(led, 0, 0, 255)
  time.sleep(1)
  blinkt.show()

# RED
if red_leds > 0:
 for led in reversed(range(int(total_leds - red_leds), int(total_leds))):
  blinkt.set_pixel(led, 255, 0, 0)
  time.sleep(1)
  blinkt.show()

# WHITE
if white_leds > 0:
 for led in reversed(range(int(total_leds - white_leds), int(total_leds))):
  blinkt.set_pixel(led, 255, 255, 255)
  time.sleep(1)
  blinkt.show()

# Debug
# print("Status: " + "B " * int(blue_leds) + "G " * int(total_leds - blue_leds - red_leds - white_leds) + "R " * int(red_leds) + "W " * int(white_leds))
Make this script executable by typing “chmod +x eddi-status.py”
Finally we need a crontab to allow a two minute run of the script between 04:00h and 20:00h. Optionally reboot the Pi every day at midnight. Type”sudo crontab -e”.
0 0 * * * root reboot
*/2 4-20 * * * sh /home/pi/pilevel/eddi-json.sh 2>/home/pi/pilevel/cronlog
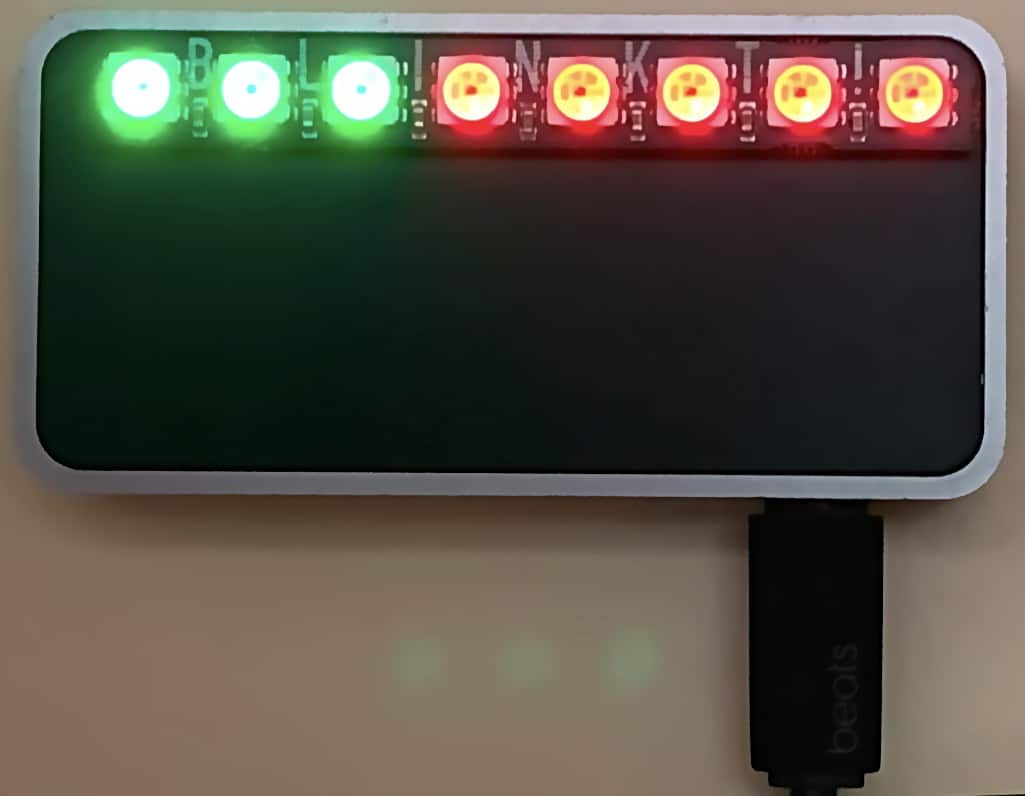
The LEDs have the following meaning:
- BLUE : The Eddi is diverting solar power
- GREEN: Solar power consumed in the house
- RED: Power pulled from the grid
- WHITE: Surplus solar power exported to the grid
The amount of LEDs show the level of power, all leds = 100% of the power. So if you have 4 green leds and 4 red leds, you are 50% energy independent. If you have 6 green and 2 white LEDs, it means you’re 100% energy independent and exporting 25% of the solar power.
That should be it, have fun!
Taking it to the next Level
You can take this to the next level, by only downloading the myenergi json file and switching the Pi Level indicator on between sunrise and sunset. For this purpose we need to add a new crontab, bash script and update the python script.
First of all, get a free API key to download a daily JSON astro file which contains the sunrise and sunset times for your location, at ipgeolocation.com.
Create the following bash script, “nano eddi-sunrise.sh”
#!/bin/bash

curl --silent -H 'accept: application/json' -H 'content-type: application/json' --compressed 'https://api.ipgeolocation.io/astronomy?apiKey=#YOURKEY&lat=45.98&long=6.3' > /tmp/eddi-sunrise.json
chmod 777 /tmp/eddi-sunrise.json
Enter your own latitude and longitude information (in the example it’s 45.9 by 6.3). Make the bash script executable with “chmod +x eddi-sunrise.sh”.
Next create a new crontab to download the JSON file once per day at 02:00. Type”sudo crontab -e” and add:
* 02 * * * sh /home/pi/pilevel/eddi-sunrise.sh 2>/home/pi/pilevel/cronlog
We need to add a new code section in our python script, insert this above the “# Obtain the power usage” section, so the script will stop excecution when it’s still dark and writes the sunrise and sunset times on to a bash script readable file for later use. Type “nano eddi-status.py”.
# Check if we are between sunrise & sunset
try:
 json_file = open("/tmp/eddi-sunrise.json", "r")
 geodata = json_file.read()
 sundata = json.loads(geodata)
 if 'sunrise' in sundata:
   sunrise = sundata['sunrise'].split(":")
 else:
   sunrise = ["04", "00"]
 if 'sunset' in sundata:
   sunset = sundata['sunset'].split(":")
 else:
   sunset = ["20", "00"]
 startday = int(sunrise[0]) * 60 * 60 + int(sunrise[1]) * 60
 endday = int(sunset[0]) * 60 * 60 + int(sunset[1]) * 60
except:
 startday = 4 * 60 * 60
 endday = 20 * 60 * 60

now = time.localtime()
inday = now.tm_hour * 60 * 60 + now.tm_min * 60
if inday < startday or inday > endday:
 f = open("/tmp/sunrise.txt", "w")
 f.write("startday=" + str(startday) + "\n")
 f.write("endday=" + str(endday) + "\n")
 f.close()
 exit()
To prevent downloading unnecessary json files, we can update our eddi-json.sh script as follows. Type”nano eddi-json.sh”:
#!/bin/bash

if [ -f "/tmp/sunrise.txt" ]; then
 . "/tmp/sunrise.txt"
 now=$(( $(date '+%-H *3600 + %-M *60 + %-S') ))
 if [ $now -lt $startday ] || [ $now -gt $endday ]; then
  python /home/pi/pilevel/blinktoff.py
 exit 0
 fi
fi

if curl --silent --anyauth -u $SERIAL:#API -H 'accept: application/json' -H 'content-type: application/json' --compressed 'https://s18.myenergi.net/cgi-jstatus-*' > /tmp/eddi.json; then

 chmod 777 /tmp/eddi.json
 python /home/pi/pilevel/eddi-status.py

fi
To switch the Blinkt off add this script, type “nano blinktoff.py”:
#!/usr/bin/env python

import blinkt

blinkt.clear()
blinkt.show()
Make the script executable with “chmod +x blinktoff.py”.
Now your system is able to switch the level indicator on at sunrise and start downloading json files every 2 minutes, and switch the downloading and level indicator off at sunset.
That’s all, success !!
